Dashboard
The Dashboard gives you a real-time overview of your vending operations at a glance.
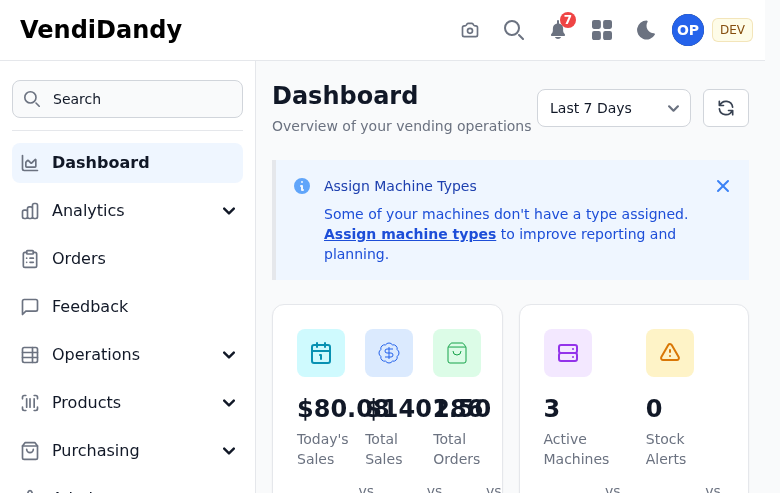
Key Metrics
The dashboard displays your most important metrics:
- Total Revenue - Sales across all machines for the selected period
- Units Sold - Total items vended
- Active Machines - Machines currently online and operational
- Low Stock Alerts - Products that need restocking soon
Date Range Selection
Use the date picker in the top right to change the time period:
- Today
- Last 7 days
- Last 30 days
- Custom range
Analytics Widgets
Revenue Chart
Shows your daily revenue trend over the selected period. Hover over any point to see the exact amount.
Top Products
Lists your best-selling products by units sold or revenue.
Machine Performance
Compare performance across your machines to identify top performers and underperformers.
Quick Actions
From the dashboard, you can:
- Click any metric to drill down to details
- Export data to CSV
- Share reports with team members